Fig. 8
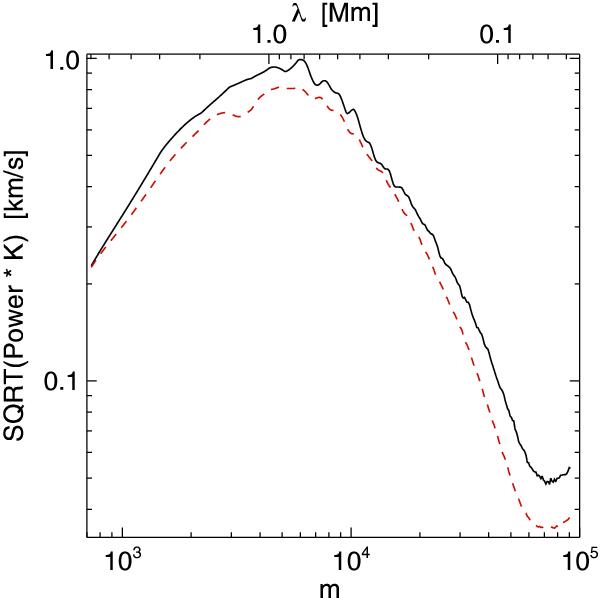
Comparison between Fourier spectra from Doppler-determined velocities and from vertical velocities on constant-τ500 surfaces, both obtained from the simulation data. Red: velocity spectra from the MHD 100 G data using Doppler shifts in the synthetic observation. The data have not been convolved spatially with a PSF nor, spectrally, with an MSRF. Black: velocity spectrum for the vertical component of the velocity taken directly from the MHD 100 G data cube on the log (τ500) = −1 surface. No p-mode filtering has been applied to obtain this figure.
Current usage metrics show cumulative count of Article Views (full-text article views including HTML views, PDF and ePub downloads, according to the available data) and Abstracts Views on Vision4Press platform.
Data correspond to usage on the plateform after 2015. The current usage metrics is available 48-96 hours after online publication and is updated daily on week days.
Initial download of the metrics may take a while.