Fig. 7
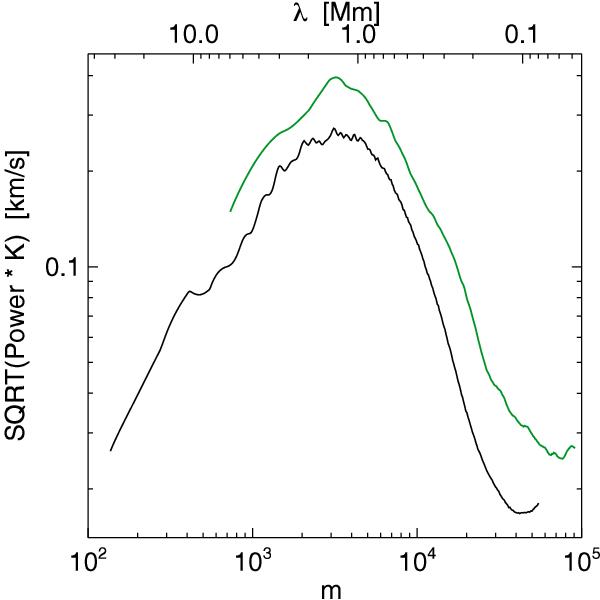
Velocity spectra for the horizontal velocity computed from LCT eliminating the instrumental effects. The solid black curve corresponds to the first IMaX time series deconvolved with the PSF′ function introduced in Sect. 4. The green line corresponds to the HD simulation run without application of any instrumental degradation.
Current usage metrics show cumulative count of Article Views (full-text article views including HTML views, PDF and ePub downloads, according to the available data) and Abstracts Views on Vision4Press platform.
Data correspond to usage on the plateform after 2015. The current usage metrics is available 48-96 hours after online publication and is updated daily on week days.
Initial download of the metrics may take a while.