Fig. 6
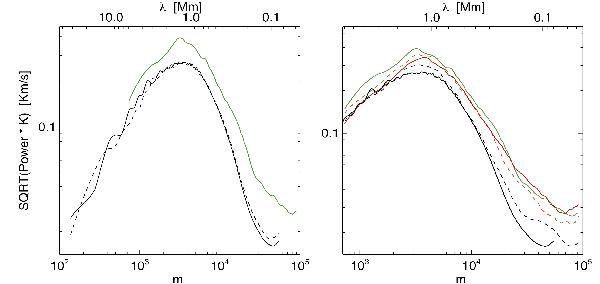
Velocity spectra for the horizontal velocity computed through local correlation tracking applied to continuum images near the Fe I 5250.2 Å line from the IMaX observations and from synthetic observations obtained from the simulation runs. Left panel: first (dashed black) and second (solid black) IMaX time series and the HD simulation run (solid green). Right panel: spectra from the four simulation runs (green: HD run; red: MHD 50 G run; dashed orange line: MHD 100 G run; dashed black line: MHD 200 G run). The corresponding portion of the second IMaX time series (solid black line) is added for comparison.
Current usage metrics show cumulative count of Article Views (full-text article views including HTML views, PDF and ePub downloads, according to the available data) and Abstracts Views on Vision4Press platform.
Data correspond to usage on the plateform after 2015. The current usage metrics is available 48-96 hours after online publication and is updated daily on week days.
Initial download of the metrics may take a while.