Fig. 5
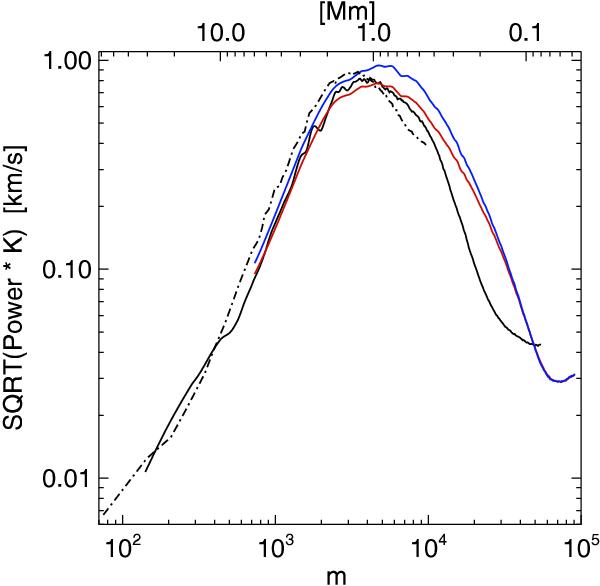
Comparison with the Hinode-based Fourier spectrum of the Doppler velocity by Rieutord et al. (2010). Solid black: spectrum from our second IMaX time series deconvolved with the PSF′ function introduced in Sect. 4. Dash-dotted: velocity spectrum computed from a power spectrum in Fig. 6 of Rieutord et al. (2010), for a time series obtained from Hinode/NFI for the Fe I 5576.09 Å line. Red and blue curves: velocity spectra from our 50 G MHD simulation run with spectral synthesis carried out for the Fe I 5250.2 Å line and for the Fe I 5576.09 Å line, respectively. To obtain those curves, we have not applied any instrumental degradation (PSF′ and MSRF) to the simulated data.
Current usage metrics show cumulative count of Article Views (full-text article views including HTML views, PDF and ePub downloads, according to the available data) and Abstracts Views on Vision4Press platform.
Data correspond to usage on the plateform after 2015. The current usage metrics is available 48-96 hours after online publication and is updated daily on week days.
Initial download of the metrics may take a while.