Fig. 3
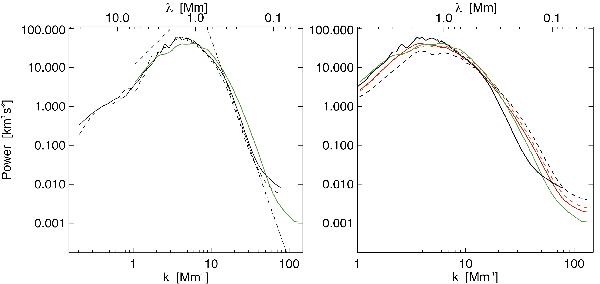
Power spectra P(k) of the Doppler velocity as a function of k. The curves here are for the same datasets as in Fig. 2 and with the same color and line style criteria. Left: spectra for the observational data and for the HD run. Right: the four simulated runs and the corresponding portion of the second IMaX time series (solid black line). The straight lines in the left panel show power laws ∝ k2 (dashed line), ∝ k−17/3 (dash-dotted) and ∝ k−29/3 (solid).
Current usage metrics show cumulative count of Article Views (full-text article views including HTML views, PDF and ePub downloads, according to the available data) and Abstracts Views on Vision4Press platform.
Data correspond to usage on the plateform after 2015. The current usage metrics is available 48-96 hours after online publication and is updated daily on week days.
Initial download of the metrics may take a while.