Fig. 2
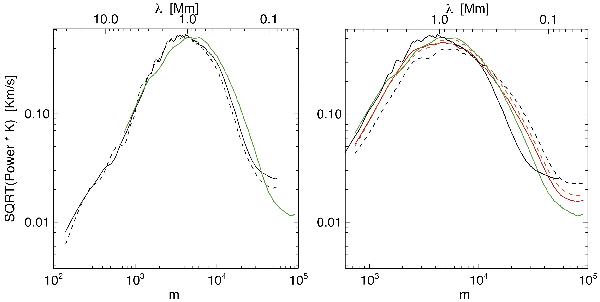
Velocity spectra V(k) of the Doppler velocity computed from the shift of the Stokes-I signal of the Fe I 5250.2 Å line. In abscissas we use the spherical harmonic wavenumber (m, lower horizontal axis) or the corresponding wavelength λ (upper horizontal axis). Left panel: curves corresponding to the first IMaX time series (dashed black line); second IMaX time series (solid black line) and the HD simulation run (solid green line). Right: curves corresponding to the simulated HD/MHD time series (solid green: HD; solid red: MHD 50 G; dashed orange: MHD 100 G; dashed black: MHD 200 G). The curve corresponding to the second IMaX time series (solid black line) is added for comparison
Current usage metrics show cumulative count of Article Views (full-text article views including HTML views, PDF and ePub downloads, according to the available data) and Abstracts Views on Vision4Press platform.
Data correspond to usage on the plateform after 2015. The current usage metrics is available 48-96 hours after online publication and is updated daily on week days.
Initial download of the metrics may take a while.