Fig. 6
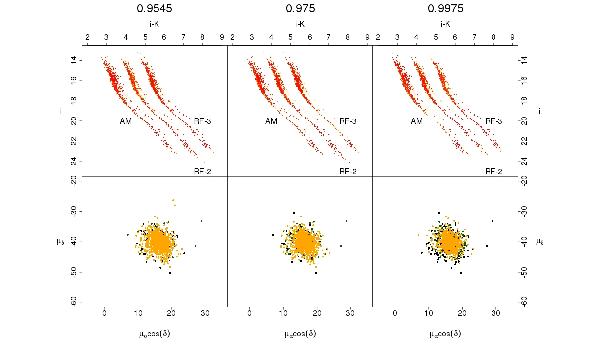
Vector point diagrams (bottom row) and (i − K)–i CMDs (top row) of sources in the DANCe catalogue (both complete and incomplete) with membership probabilities above 0.9975, for three values of the admission threshold pin to the definition set (0.9545 in the left column, 0.975 in the middle column, and 0.9975 in theright column). Each CMD shows the three cluster sequences obtained with the AM (left), RF-2 (middle), and RF-3 (right) representation spaces. The colour code in the top row reflects the membership probability in a linear scale from yellow (p = 0.9975) to red (p = 1). In the VPD diagrams, we use black, green, and orange points to represent candidates obtained in the AM, RF-2, and RF-3 representation spaces.
Current usage metrics show cumulative count of Article Views (full-text article views including HTML views, PDF and ePub downloads, according to the available data) and Abstracts Views on Vision4Press platform.
Data correspond to usage on the plateform after 2015. The current usage metrics is available 48-96 hours after online publication and is updated daily on week days.
Initial download of the metrics may take a while.