Fig. 3
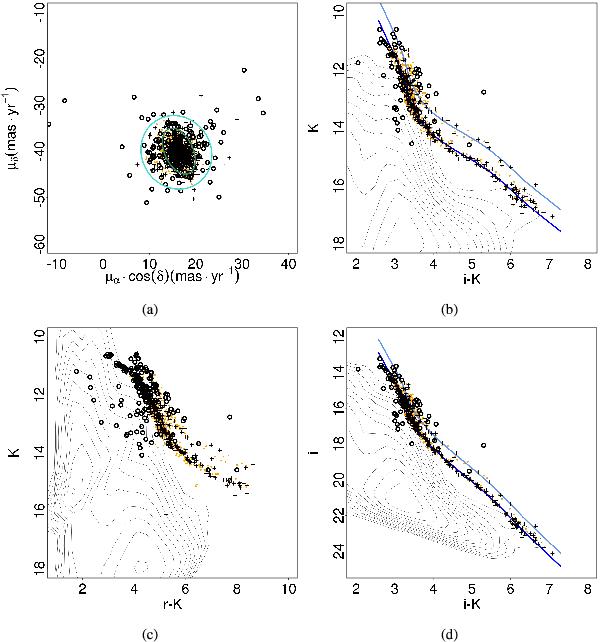
Distribution of the sources that define the combined curvilinear and Gaussian likelihood model (the final reference set after all EM iterations) in the same 2D projections used in Fig. 1 (the VPD, and the (i − K)–K, (r − K)–K, and (i − K)–i CMDs). Black circles represent sources in the initial reference set that were removed during the EM iterations, and black crosses represent complete sources added in the iterative process. Orange dots represent sources in both the initial and final reference sets.
Current usage metrics show cumulative count of Article Views (full-text article views including HTML views, PDF and ePub downloads, according to the available data) and Abstracts Views on Vision4Press platform.
Data correspond to usage on the plateform after 2015. The current usage metrics is available 48-96 hours after online publication and is updated daily on week days.
Initial download of the metrics may take a while.