Free Access
Fig. 2
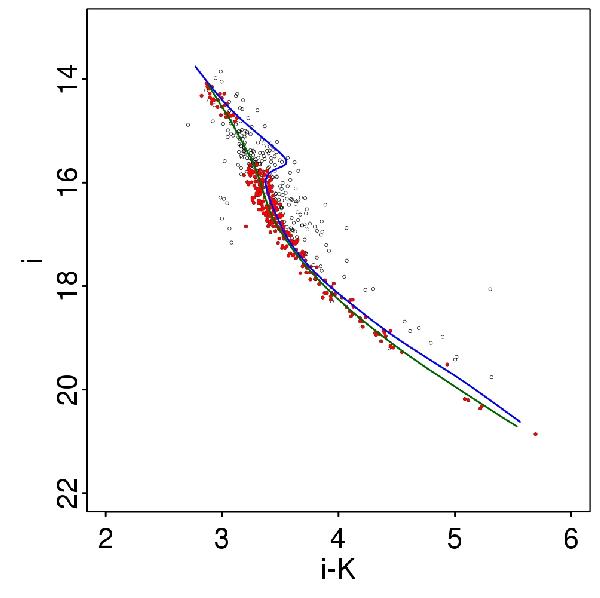
Principal curve fits to the initial reference set (blue line) and to the subset of sources with all magnitudes fainter than its closest point in the first principal curve (green line). This subset of points is represented in red.
Current usage metrics show cumulative count of Article Views (full-text article views including HTML views, PDF and ePub downloads, according to the available data) and Abstracts Views on Vision4Press platform.
Data correspond to usage on the plateform after 2015. The current usage metrics is available 48-96 hours after online publication and is updated daily on week days.
Initial download of the metrics may take a while.