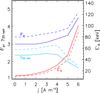
Fig. 8
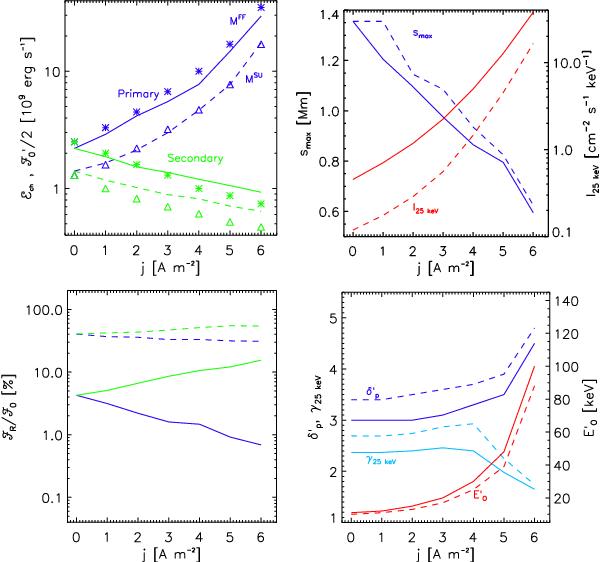
GRTTM summary of calculated parameters of chromospheric bombardment for various current densities j. The solid lines and asterisks denote the MFF, the dashed lines and triangles denote the MSU. Left: chromospheric energy deposit ℰch (lines) and fitted energy flux  (symbols) (top), the ratio ℱR/ℱ0(bottom) for the primary (blue) and secondary (green) footpoints. Right: position of energy deposit maximum smax and HXR intensity I25 keV (top), HXR spectral index γ25 keV, fitted electron beam spectral index
  and low-energy cutoff
  (bottom) only for the primary footpoint.
Current usage metrics show cumulative count of Article Views (full-text article views including HTML views, PDF and ePub downloads, according to the available data) and Abstracts Views on Vision4Press platform.
Data correspond to usage on the plateform after 2015. The current usage metrics is available 48-96 hours after online publication and is updated daily on week days.
Initial download of the metrics may take a while.