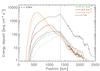
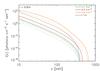
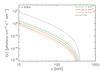
Fig. 7
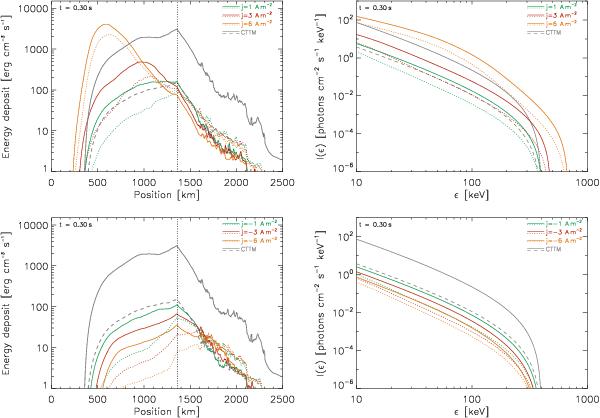
GRTTM instantaneous energy deposits (left) and HXR spectra (right) for the primary (top) and secondary (bottom) footpoints and the VAL C atmosphere at t = 0.3 s. The green, red, and orange solid (MFF) and dotted (MSU) lines correspond to the current densities j = 1,3,6 A m-2, respectively, and to the energy flux ℱ0/2 = 2.5 × 10⁹ erg cm-2 s-1. The grey dashed and solid lines correspond to the CTTM with ℱ0/2 = 2.5 × 10⁹ and 5 × 10¹⁰ erg cm-2 s-1, respectively. The dotted straight vertical line indicates the bottom boundary of the magnetic mirror. The HXR spectra are integrated over one half of the loop.
Current usage metrics show cumulative count of Article Views (full-text article views including HTML views, PDF and ePub downloads, according to the available data) and Abstracts Views on Vision4Press platform.
Data correspond to usage on the plateform after 2015. The current usage metrics is available 48-96 hours after online publication and is updated daily on week days.
Initial download of the metrics may take a while.