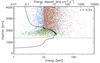
Fig. 6
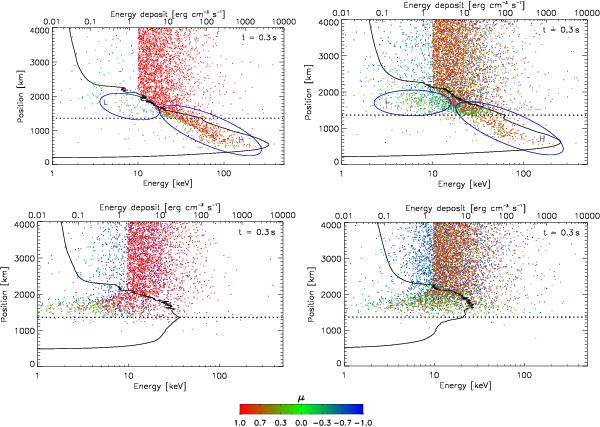
GRTTM distribution functions of non-thermal electron energies versus positions with a colour coded M(μ0) corresponding to the current density j = 6 A m-2 in the VAL C atmosphere at time t = 0.3 s after the beam injection into the loop at its apex. Top: primary footpoint, bottom: secondary footpoint, left: MFF, right: MSU. The solid lines indicate the instantaneous energy deposits corresponding to ℱ0/2 = 2.5 × 10⁹ erg cm-2 s-1, the dotted horizontal lines the bottom boundary of the magnetic mirror and the blue ellipses labelled L and H denote tails in the particle distribution function. Only the vicinity of the footpoints are displayed.

Current usage metrics show cumulative count of Article Views (full-text article views including HTML views, PDF and ePub downloads, according to the available data) and Abstracts Views on Vision4Press platform.
Data correspond to usage on the plateform after 2015. The current usage metrics is available 48-96 hours after online publication and is updated daily on week days.
Initial download of the metrics may take a while.