Fig. 7
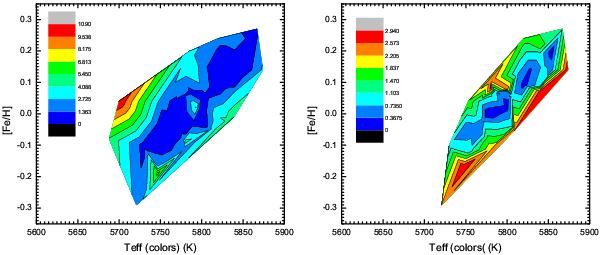
Left: color similarity index SC plotted versus the final photometric Teff (obtained from the spectroscopic [Fe/H]) and the spectroscopic [Fe/H] for all spectroscopically analyzed stars. The vertical colored bar is coded by the SC values: note that the scale of the coding is different between the two plots. Right: same as the left panel, but for the stars with SC ≤ 3.0. It is clear that a combination of hot/metal rich and cool/metal poor parameters defines an area of good photometric similarity to the Sun, and also that the stars with the highest color similarity to the Sun have atmospheric parameters more tightly clustered around the solar values.
Current usage metrics show cumulative count of Article Views (full-text article views including HTML views, PDF and ePub downloads, according to the available data) and Abstracts Views on Vision4Press platform.
Data correspond to usage on the plateform after 2015. The current usage metrics is available 48-96 hours after online publication and is updated daily on week days.
Initial download of the metrics may take a while.