Fig. 5
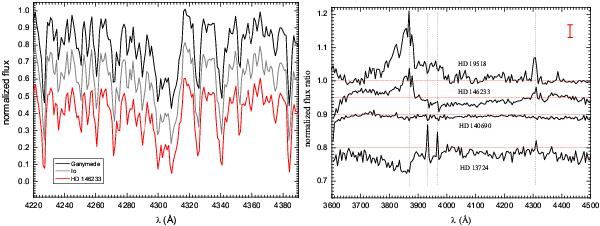
Left: sample of normalized ESO/UV spectra in the λλ4220−4390 range, around the λ4310 CH bandhead. The nominal resolution is R = 800, and the spectra are arbitrarily displaced on the vertical axis. Right: sample ratioed ESO/UV spectra, normalized to the solar (Ganymede) spectra, in the λλ3600−4500 range. The spectra are arbitrarily displaced in the vertical axis, and the horizontal red lines mark the unitary flux ratios for each object. The dotted lines are, from left to right, respectively, the approximate central wavelength of the λ3870 CN bandhead, the central wavelengths of the K and H Ca ii lines, and the approximate central wavelength of the λ4310 CH bandhead. The 1σ flux ratio error bar is shown in red.
Current usage metrics show cumulative count of Article Views (full-text article views including HTML views, PDF and ePub downloads, according to the available data) and Abstracts Views on Vision4Press platform.
Data correspond to usage on the plateform after 2015. The current usage metrics is available 48-96 hours after online publication and is updated daily on week days.
Initial download of the metrics may take a while.