Fig. 8
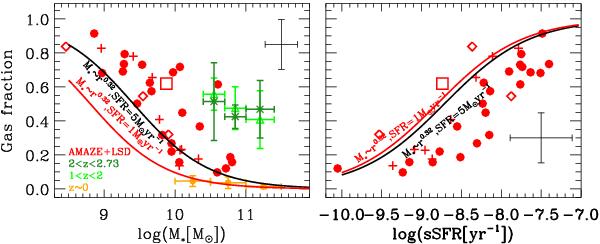
Gas fraction as a function of stellar mass and sSFR. The red symbols show the AMAZE+LSD galaxies at z ~ 3–5 (same symbol-coding as Fig. 2). The solid lines show the incompleteness limit in the AMAZE unlensed (black) and lensed (red) galaxies. In the left panel the orange dots show the average gas fractions of local massive galaxies in bins of stellar mass, while green asterisks and triangles show the averages of the galaxies at 1 < z < 2 and 2 < z < 2.73, respectively, whose gas content has been measured through CO observations (Daddi et al. 2010; Saintonge et al. 2011, 2013; Tacconi et al. 2013). The upper-right error bars show the median error on the gas fraction and on the stellar mass in our sample. Right panel: gas fraction as a function of the sSFR, with the same symbol code as in the left panel.
Current usage metrics show cumulative count of Article Views (full-text article views including HTML views, PDF and ePub downloads, according to the available data) and Abstracts Views on Vision4Press platform.
Data correspond to usage on the plateform after 2015. The current usage metrics is available 48-96 hours after online publication and is updated daily on week days.
Initial download of the metrics may take a while.