Fig. 7
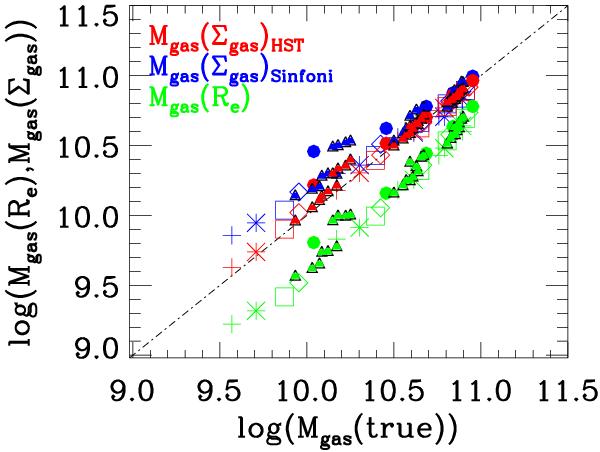
Mass of gas of the simulated galaxies with different Sérsic profiles (0.5 < n < 4) and different effective radii (5 < Re < 2.5 kpc) inferred with the two different methods discussed in the text. The x-axis shows the true gas mass (input in the simulated galaxy), while the y-axis shows either the gas mass calculated with the old method of using the total SFR and effective radius to infer an average gas surface density (Mgas(Re), green symbols), or the gas mass calculated with our new method, measuring the Σgas pixel by pixel in the data (Mgas(Σgas), red and blue symbols). Red symbols show the simulations of HST data and blue symbols show the simulation of SINFONI data. The green symbols are independent of the method since they use the integrated properties of galaxies. Galaxies modeled with Sersic indices n = 0.5,1,2,3,4 are shown by crosses, asterisks, squares, diamonds, and circles, respectively. Interacting systems are marked with black triangles.
Current usage metrics show cumulative count of Article Views (full-text article views including HTML views, PDF and ePub downloads, according to the available data) and Abstracts Views on Vision4Press platform.
Data correspond to usage on the plateform after 2015. The current usage metrics is available 48-96 hours after online publication and is updated daily on week days.
Initial download of the metrics may take a while.