Fig. 3
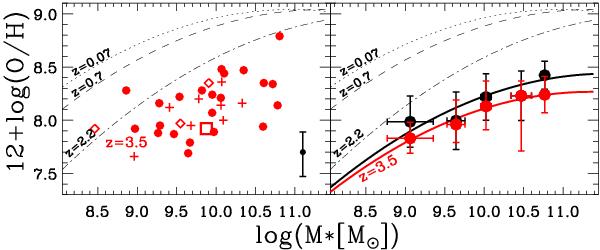
Mass-metallicity relation for the galaxies in the AMAZE and LSD samples. The left panel shows the individual AMAZE and LSD galaxies at z ~ 3–5 (same symbol codes as in Fig. 2). The overplotted lines (dotted, dashed, dot-dashed) shows the mass–metallicity relation at lower redshifts from previous studies (z ~ 0.07,0.7, and 2.2 respectively, see Maiolino et al. 2008). The average error bar on the metallicity determination is shown in the lower-right corner. In the right panel the data are binned according to stellar mass. The black circles show the average metallicities within each stellar mass bin, while the red circles show the metallicity inferred from the spectra stacked in the same bins. The solid black line shows the fit to the average metallicities, while the red solid line shows the fit to the metallicity of the stacked spectra.
Current usage metrics show cumulative count of Article Views (full-text article views including HTML views, PDF and ePub downloads, according to the available data) and Abstracts Views on Vision4Press platform.
Data correspond to usage on the plateform after 2015. The current usage metrics is available 48-96 hours after online publication and is updated daily on week days.
Initial download of the metrics may take a while.