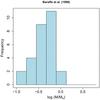
Fig. 7
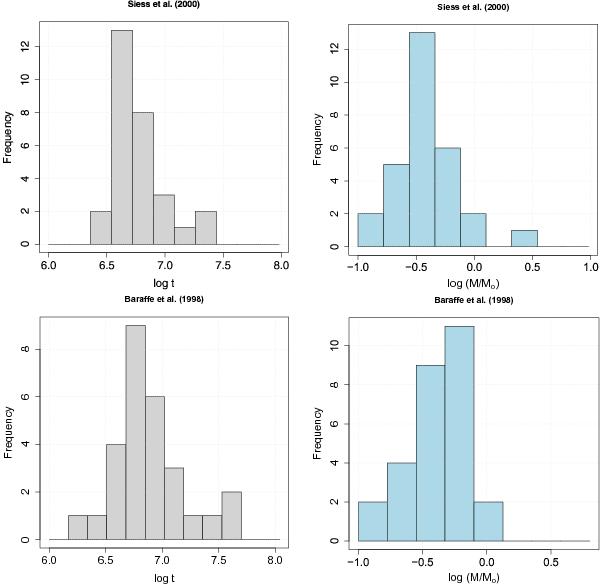
Age (in log t) and mass (in log M) distributions for the TWA stars listed in Table 5 obtained with the grid of evolutionary models computed by Siess et al. 2000 (upper panels) and Baraffe et al. 1998 (lower panels). TWA 9A, TWA 21 and TWA 23 are the stars plotted near log t = 7.5, and TWA 11A is the star plotted near log (M/M⊙) = 0.5 in the upper panels. The Barrafe tracks do not cover such large masses.
Current usage metrics show cumulative count of Article Views (full-text article views including HTML views, PDF and ePub downloads, according to the available data) and Abstracts Views on Vision4Press platform.
Data correspond to usage on the plateform after 2015. The current usage metrics is available 48-96 hours after online publication and is updated daily on week days.
Initial download of the metrics may take a while.