Fig. 8
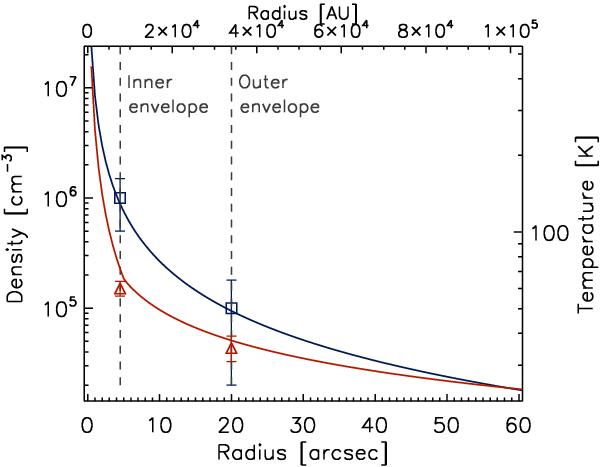
Radial profiles of the density (blue line) and temperature (red line) toward NGC 6334 I from R11. The vertical lines indicate, respectively, the radius of the inner and outer regions obtained from our LVG analysis. The density (blue squares) and temperature (red triangles) values obtained for each component are overlaid on the plot.
Current usage metrics show cumulative count of Article Views (full-text article views including HTML views, PDF and ePub downloads, according to the available data) and Abstracts Views on Vision4Press platform.
Data correspond to usage on the plateform after 2015. The current usage metrics is available 48-96 hours after online publication and is updated daily on week days.
Initial download of the metrics may take a while.