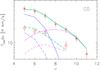
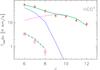
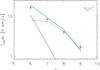
Fig. 7
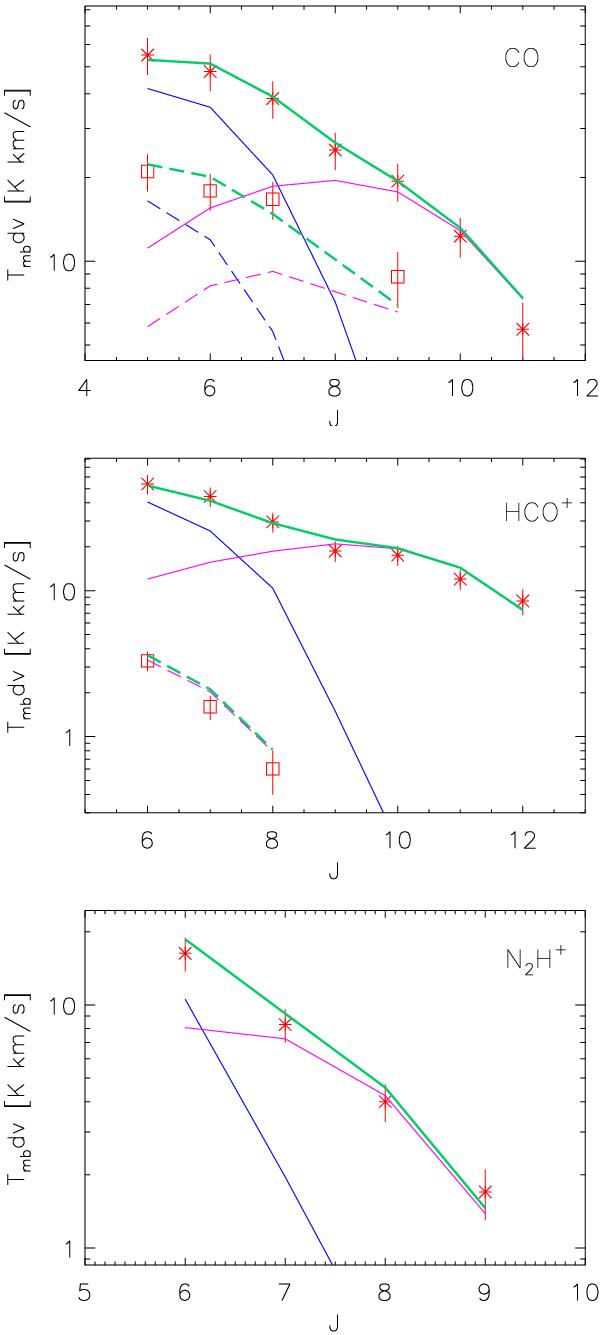
Plots of integrated intensity vs. Jup (from top to bottom) for the C18O (red stars) and C17O (red squares), HCO+ (stars) and H13CO+ (squares), and N2H+ (stars) spectral line emission, obtained from the LVG model. The blue and pink lines represent, respectively, the theoretical model for the outer and inner envelope components, and the green lines represent the sum of the two components. The solid lines represent the model results for C18O, HCO+, and N2H+, while the dashed lines represent the model results for C17O and H13CO+.
Current usage metrics show cumulative count of Article Views (full-text article views including HTML views, PDF and ePub downloads, according to the available data) and Abstracts Views on Vision4Press platform.
Data correspond to usage on the plateform after 2015. The current usage metrics is available 48-96 hours after online publication and is updated daily on week days.
Initial download of the metrics may take a while.