Free Access
Fig. 6
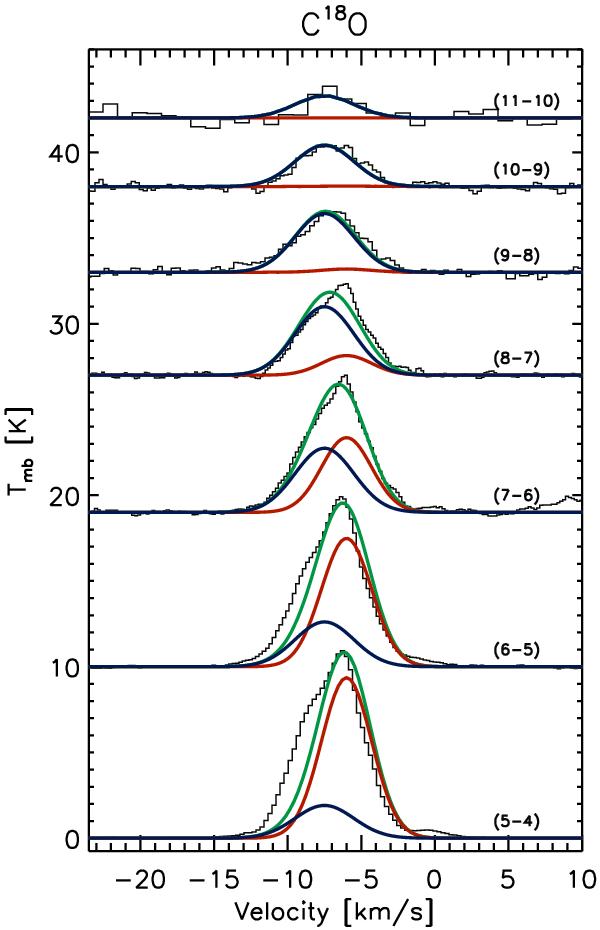
Example of the C18O spectra, overlaid with the double Gaussian profile derived from the results of the LVG analysis. The red, blue, and green lines show, respectively, the Gaussian profiles for the outer and inner envelope emission, and the sum of the two components.
Current usage metrics show cumulative count of Article Views (full-text article views including HTML views, PDF and ePub downloads, according to the available data) and Abstracts Views on Vision4Press platform.
Data correspond to usage on the plateform after 2015. The current usage metrics is available 48-96 hours after online publication and is updated daily on week days.
Initial download of the metrics may take a while.