Free Access
Fig. 4
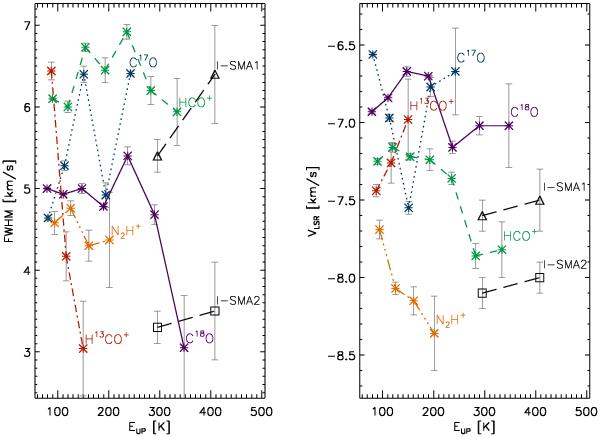
FWHM (left panel) and velocity (right panel) vs. upper level energy Eup, for each of the molecular tracers. The NH3(5,5) and (6,6) observations reported by Beuther et al. (2007) for I-SMA1(triangles) and I-SMA2 (squares) are plotted as reference.
Current usage metrics show cumulative count of Article Views (full-text article views including HTML views, PDF and ePub downloads, according to the available data) and Abstracts Views on Vision4Press platform.
Data correspond to usage on the plateform after 2015. The current usage metrics is available 48-96 hours after online publication and is updated daily on week days.
Initial download of the metrics may take a while.