Fig. 6
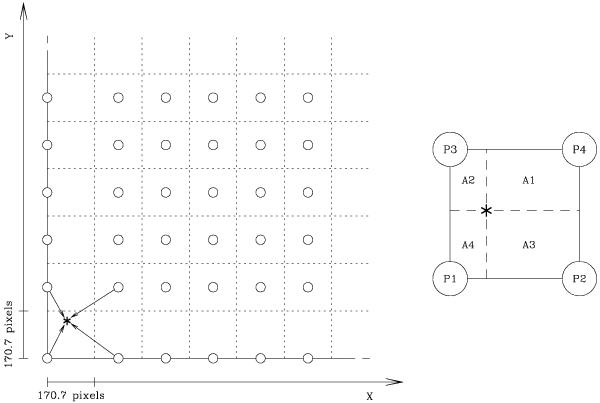
Left: example of cell and grid-point locations on the bottom-left area of chip[1]. Dotted lines mark the 170.7 × 170.7 pixels square elements inside which we computed the median value of the distortion residual to use as grid point (empty circles) in the look-up table. For a given star (marked with an ∗), we used the four surrounding closest grid point to perform the bi-linear interpolation (sketched with the arrows) and evaluate the residual geometric distortion in that location of the detector. Right: Bi-linear interpolation outline. Each grid point P1,...,P4 is weighted by the corresponding area A1,...,A4 to associate the correction in ∗.
Current usage metrics show cumulative count of Article Views (full-text article views including HTML views, PDF and ePub downloads, according to the available data) and Abstracts Views on Vision4Press platform.
Data correspond to usage on the plateform after 2015. The current usage metrics is available 48-96 hours after online publication and is updated daily on week days.
Initial download of the metrics may take a while.