Fig. 5
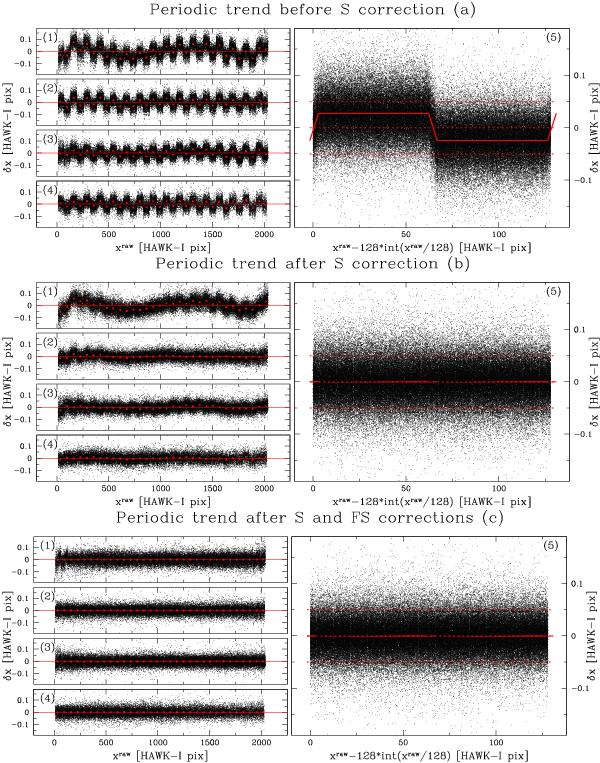
Top: δx as a function of X in units of HAWK-I pixels before S correction. Middle: as above but after S correction. Bottom: same as above but after S and FS corrections. In the left panels (from 1 to 4), we took 32 bins of 64 pixels each and computed the median of residuals in each bin (red squares). In the right panels (5), we show the periodogram with a period of 128 columns containing all the points plotted in the left panels. The dashed red lines show + 0.05, 0, and −0.05 HAWK-I pixel.
Current usage metrics show cumulative count of Article Views (full-text article views including HTML views, PDF and ePub downloads, according to the available data) and Abstracts Views on Vision4Press platform.
Data correspond to usage on the plateform after 2015. The current usage metrics is available 48-96 hours after online publication and is updated daily on week days.
Initial download of the metrics may take a while.