Fig. 4
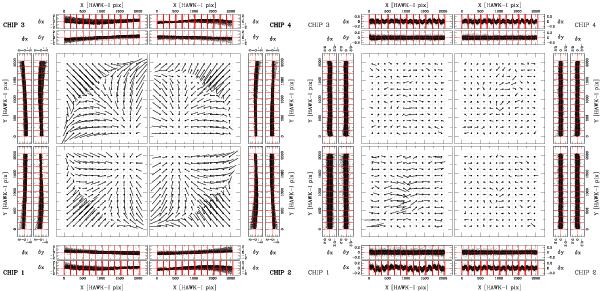
HAWK-I@VLT distortion map for Ks filter. Left: residual trends for the four chips when we use uncorrected stars’ positions. The size of the residual vectors is magnified by a factor of 500. For each chip, we also plot the single residual trends along X and Y axes. Units are expressed in HAWK-I raw pixel. Right: residuals after our polynomial correction is applied. The size of the residual vectors is now magnified by a factor 5000.

Current usage metrics show cumulative count of Article Views (full-text article views including HTML views, PDF and ePub downloads, according to the available data) and Abstracts Views on Vision4Press platform.
Data correspond to usage on the plateform after 2015. The current usage metrics is available 48-96 hours after online publication and is updated daily on week days.
Initial download of the metrics may take a while.