Free Access
Fig. B.3
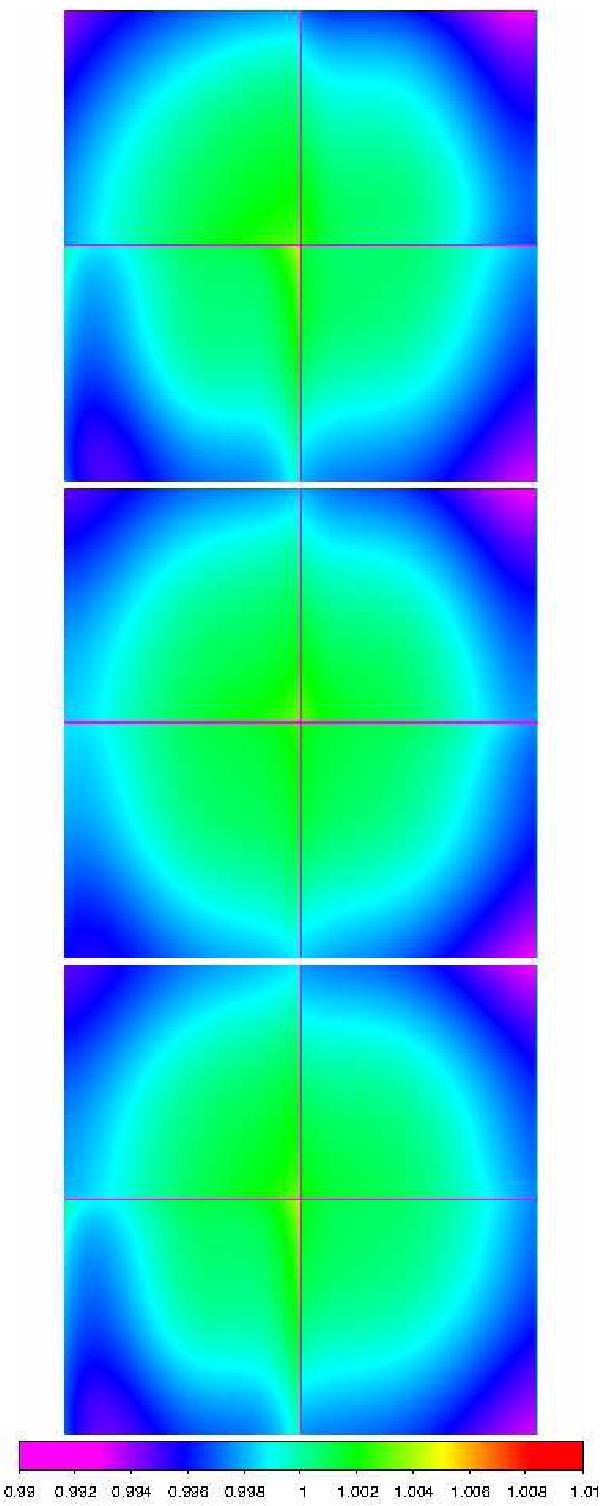
Maps of the pixel area corrections. From top to bottom, J-, H-, and KS-filter corrections. The values in the color bar represent the corrected area of the pixels. Before the correction, all pixels have an area of 1 pixel2. The scale in the images is linear.
Current usage metrics show cumulative count of Article Views (full-text article views including HTML views, PDF and ePub downloads, according to the available data) and Abstracts Views on Vision4Press platform.
Data correspond to usage on the plateform after 2015. The current usage metrics is available 48-96 hours after online publication and is updated daily on week days.
Initial download of the metrics may take a while.