Fig. B.2
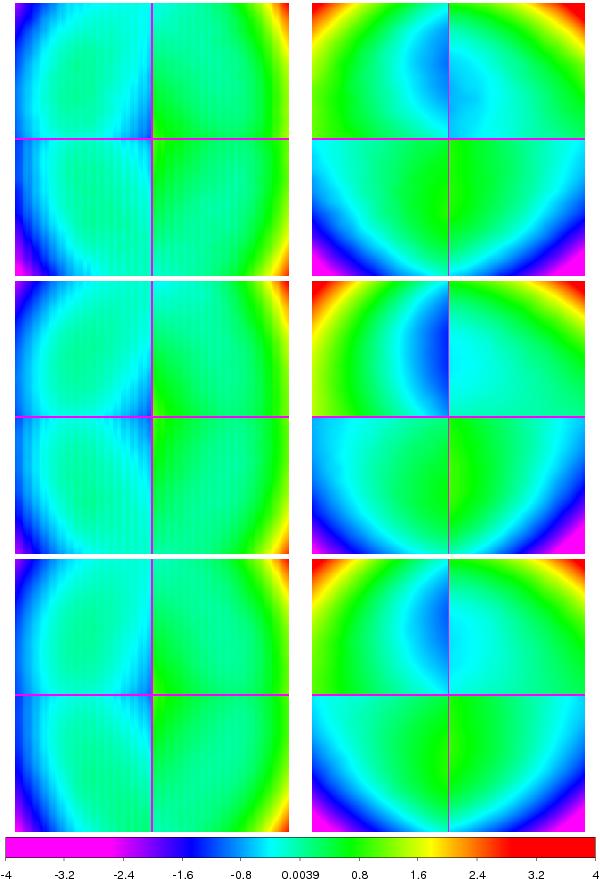
Maps of the corrections. From top to bottom, J-, H-, and KS-filter corrections. For each filter, the four chips on the left show the X-correction, while the four chips on the right show the Y-correction. A linear scale is used. Red means positive corrections; purple are negative corrections. The values in the color bar are expressed in pixels. For the J filter, the x-corrections vary between −2.95 and 2.96 pixels across the whole detector, while the y-corrections vary between −3.88 and 3.95 pixels. For the H filter, the minimum and maximum corrections for the x-coordinate are −2.40 and 2.99 pixels, while the corrections for the y-coordinate are −4.00 and 3.59 pixels. The minimum and maximum x-corrections for the KS-filter solution are −2.67 and 2.85 pixels; for y-corrections, the minimum and maximum are −3.77 and 3.42 pixels.
Current usage metrics show cumulative count of Article Views (full-text article views including HTML views, PDF and ePub downloads, according to the available data) and Abstracts Views on Vision4Press platform.
Data correspond to usage on the plateform after 2015. The current usage metrics is available 48-96 hours after online publication and is updated daily on week days.
Initial download of the metrics may take a while.