Fig. A.2
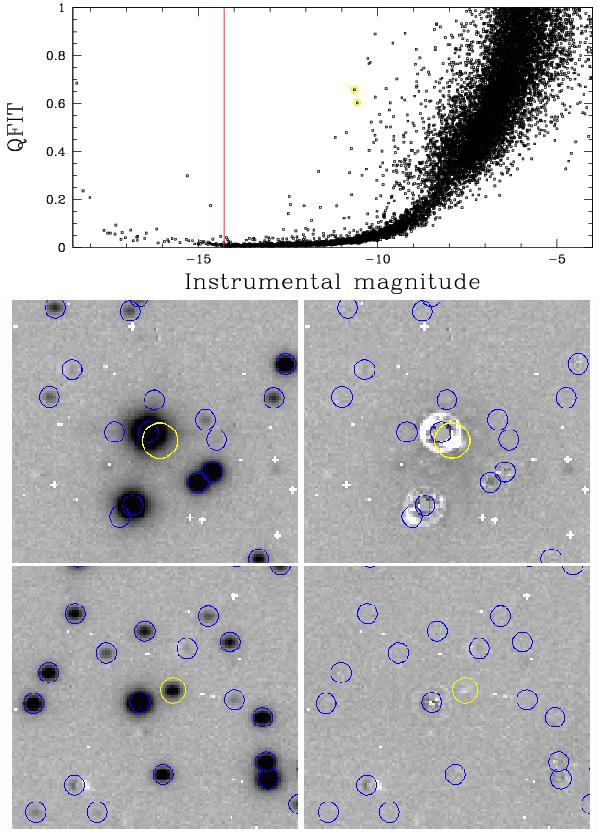
Top: QFIT parameter as a function of the instrumental magnitude J for chip[1] of exposure HAWKI.2007-08-03T01:41:29.785.fits. In yellow, we highlighted two sources with anomalously high QFIT. The red line shows the saturation limit. Middle/bottom-left: location of the two sources (in yellow) on the image. Blue circles mark all stars for which we were able to measure a position and a flux. White pixels are those flagged according to the bad-pixel mask. We do not find stars too close to these bad pixels. Middle/bottom-right: the corresponding subtracted images. The first of the two high-QFIT stars (middle-right panel) we selected is in close proximity to a saturated star; it has been poorly measured and therefore has a large QFIT value. The second star (bottom-right panel) has a cosmic ray event close to its center, increasing its total apparent flux and shifting its center on the image. This star has been over-subtracted, resulting again in a larger QFIT value.
Current usage metrics show cumulative count of Article Views (full-text article views including HTML views, PDF and ePub downloads, according to the available data) and Abstracts Views on Vision4Press platform.
Data correspond to usage on the plateform after 2015. The current usage metrics is available 48-96 hours after online publication and is updated daily on week days.
Initial download of the metrics may take a while.