Fig. 23
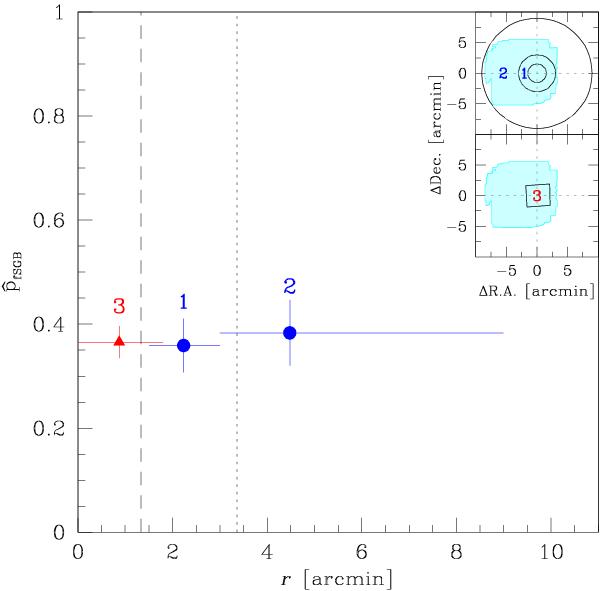
Radial trend of  . The numbers 1, 2, and 3 correspond to panels c) in Fig. 22. The points are placed at the average distance of the SGB stars used to compute the ratio in each radial bin. In blue, we plot the ratios obtained with the HAWK-I data set; in red, we show the ratio obtained with the HST data set. The vertical error bars are computed as described in the text. The horizontal error bars cover the radial intervals. The two vertical lines indicate the core radius and half-light radius (
 and
and  respectively; from Harris 1996, 2010 edition). In the top-right panels, the cyan region highlights the HAWK-I field. The cluster center is set at (0, 0). The three circles have radius 1.5, 3.0, and 9.0 arcmin. The black parallelogram represents the field covered by the HST data. The regions used to compute the ratios are labeled with the numbers 1, 2, and 3, respectively.
Current usage metrics show cumulative count of Article Views (full-text article views including HTML views, PDF and ePub downloads, according to the available data) and Abstracts Views on Vision4Press platform.
Data correspond to usage on the plateform after 2015. The current usage metrics is available 48-96 hours after online publication and is updated daily on week days.
Initial download of the metrics may take a while.