Fig. 22
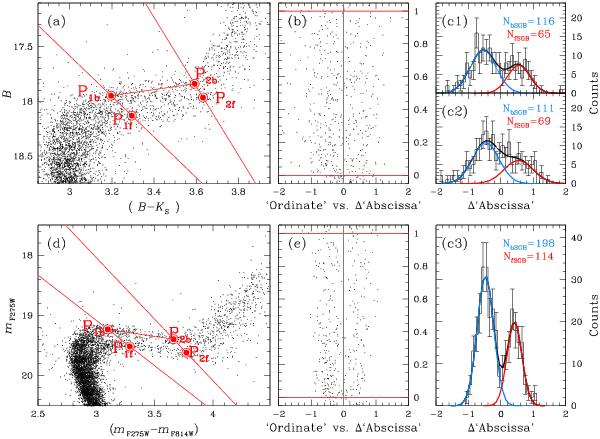
a) SGB zoom-in on B vs. (B − KS) CMD of NGC 6656. The four points (and the two straight lines) used to perform the linear transformation are plotted in red. b) Rectified SGB. The red horizontal lines are set at “Ordinate” 0 and 1; the gray solid line is set at Δ“Abscissa” = 0. c1) Dual-Gaussian fit in black; individual Gaussian in blue and red are used for bright and faint SGB respectively, for the SGB-star sample between 1.5 and 3.0 arcmin from the cluster center. c2) As for c1) but in the range 3.0−9.0 arcmin. c3), e), d) Same as in panels a), b), c1), c2) but for the HST data in the mF275W vs. (mF275W − mF814W) plane.
Current usage metrics show cumulative count of Article Views (full-text article views including HTML views, PDF and ePub downloads, according to the available data) and Abstracts Views on Vision4Press platform.
Data correspond to usage on the plateform after 2015. The current usage metrics is available 48-96 hours after online publication and is updated daily on week days.
Initial download of the metrics may take a while.