Fig. 17
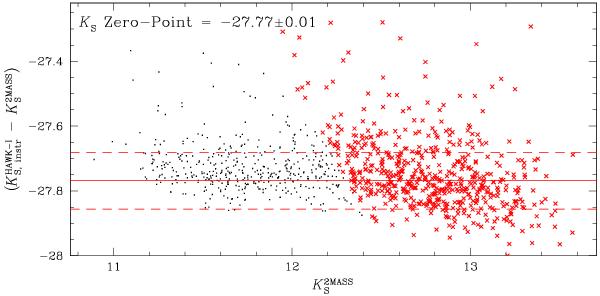
Magnitude difference between HAWK-I and 2MASS as function of the 2MASS magnitude. The black dots represent all the stars matched between HAWK-I and 2MASS with good photometry. Red crosses show stars from the saturation limit (KS =−15.46) to two magnitudes fainter. The solid red line is the zero-point (median of the magnitude difference of the red crosses); the dashed line are set at a zero-point ± 1σ (defined as the 68.27th percentile of the distribution around the median). The label in the top left corner gives the zero-point ± σ/ , where N is the number of stars used to compute the zero-point.
Current usage metrics show cumulative count of Article Views (full-text article views including HTML views, PDF and ePub downloads, according to the available data) and Abstracts Views on Vision4Press platform.
Data correspond to usage on the plateform after 2015. The current usage metrics is available 48-96 hours after online publication and is updated daily on week days.
Initial download of the metrics may take a while.