Fig. B.1
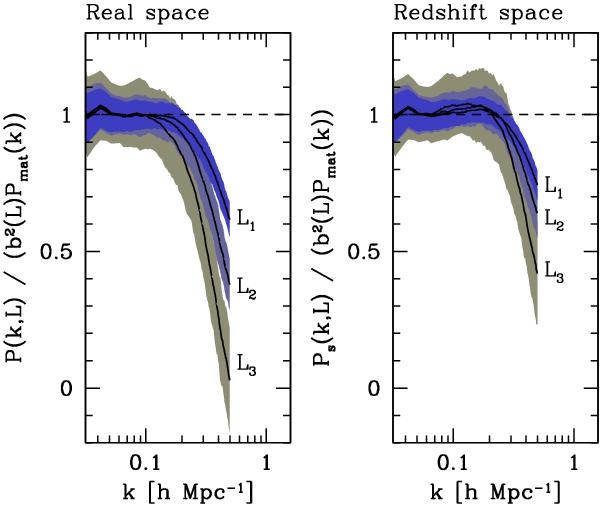
Halo exclusion: ratio between the measured cluster power spectrum described in Sect. 2.3 and the expected linear cluster power spectrum b2(L)Pmat(k), for clusters in four different bins of X-ray luminosity characterized by a luminosity Li, with L3 > L2 > L1. The luminosity bias b2(L) is that measured from the simulations. The shaded regions and the solid line represent the standard deviation and the mean, respectively, obtained from the N-body simulations.
Current usage metrics show cumulative count of Article Views (full-text article views including HTML views, PDF and ePub downloads, according to the available data) and Abstracts Views on Vision4Press platform.
Data correspond to usage on the plateform after 2015. The current usage metrics is available 48-96 hours after online publication and is updated daily on week days.
Initial download of the metrics may take a while.