Fig. A.1
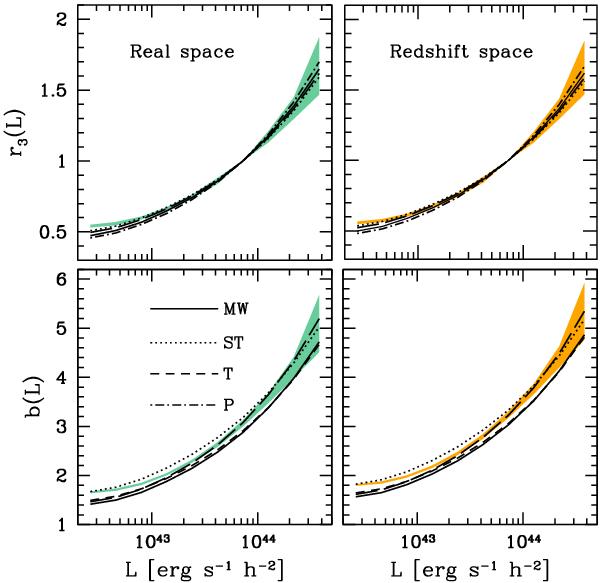
Ratio r3(L) (top panels) defined in Eq. (7), and luminosity bias b(L) (bottom panels) obtained in the range 0.02 ≤ k/(h Mpc-1) ≤ 0.08. Results are shown in real (right panel) and redshift (left panel) space. For readability, we only show the standard deviation obtained from the N-body simulations with shaded regions. The lines represent the predictions presented in Sect. 2.4.1 using expressions for the halo-mass bias as reported by different authors, MW: Mo & White (1996); ST: Sheth & Tormen (1999); T: Tinker et al. (2010); and P: Pillepich et al. (2010).
Current usage metrics show cumulative count of Article Views (full-text article views including HTML views, PDF and ePub downloads, according to the available data) and Abstracts Views on Vision4Press platform.
Data correspond to usage on the plateform after 2015. The current usage metrics is available 48-96 hours after online publication and is updated daily on week days.
Initial download of the metrics may take a while.