Fig. 4
Joint 1σ
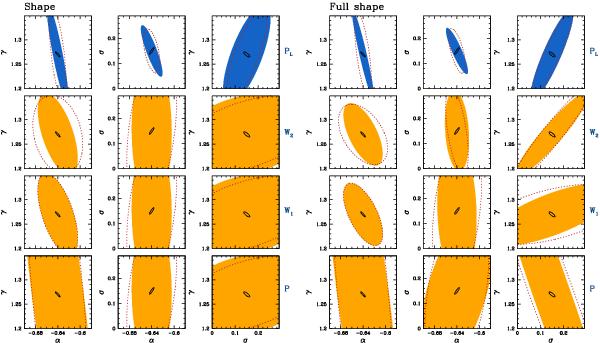
error ellipses for the parameters { α,γ,σ } of the scaling relation
 ,
obtained from the Fisher-matrix analysis of power spectra P(k),
,
obtained from the Fisher-matrix analysis of power spectra P(k),
 and PL(k)
defined in Sect. 2.3. Results are shown in real
(shaded area) and redshift (dotted lines) space. The estimates of these spectra are
obtained within the full-luminosity range and using Fourier modes in the interval
0.02 < k/(h Mpc-1) < 0.2.
The solid contours represent the results using the XLF. The right block of
panels shows the results using after marginalizing over the amplitude of
the power spectra. The left block shows the results using the full
shape. The color of the first row is meant to highlight the results
obtained with the luminosity power spectrum.
and PL(k)
defined in Sect. 2.3. Results are shown in real
(shaded area) and redshift (dotted lines) space. The estimates of these spectra are
obtained within the full-luminosity range and using Fourier modes in the interval
0.02 < k/(h Mpc-1) < 0.2.
The solid contours represent the results using the XLF. The right block of
panels shows the results using after marginalizing over the amplitude of
the power spectra. The left block shows the results using the full
shape. The color of the first row is meant to highlight the results
obtained with the luminosity power spectrum.
Current usage metrics show cumulative count of Article Views (full-text article views including HTML views, PDF and ePub downloads, according to the available data) and Abstracts Views on Vision4Press platform.
Data correspond to usage on the plateform after 2015. The current usage metrics is available 48-96 hours after online publication and is updated daily on week days.
Initial download of the metrics may take a while.