Fig. 2
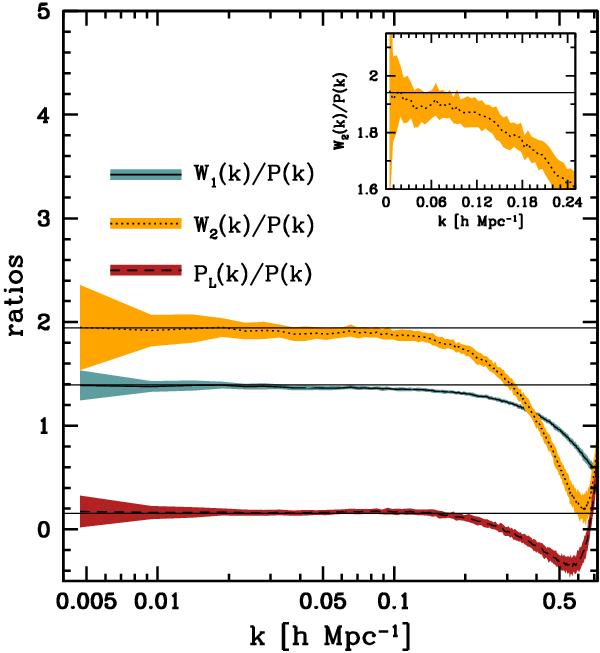
Ratio between the spectra  and
and  to the cluster power spectrum
  ,
shown in real space. The horizontal lines show the predictions presented in
Appendix A. The shaded regions denote the
standard deviation obtained from the ensemble of N-body simulations.
The inset shows a close-up of the ratio
,
shown in real space. The horizontal lines show the predictions presented in
Appendix A. The shaded regions denote the
standard deviation obtained from the ensemble of N-body simulations.
The inset shows a close-up of the ratio
 ,
showing a clear scale-dependent trend from scales k ≳ 0.06 h Mpc-1.
,
showing a clear scale-dependent trend from scales k ≳ 0.06 h Mpc-1.
Current usage metrics show cumulative count of Article Views (full-text article views including HTML views, PDF and ePub downloads, according to the available data) and Abstracts Views on Vision4Press platform.
Data correspond to usage on the plateform after 2015. The current usage metrics is available 48-96 hours after online publication and is updated daily on week days.
Initial download of the metrics may take a while.