Fig. 1
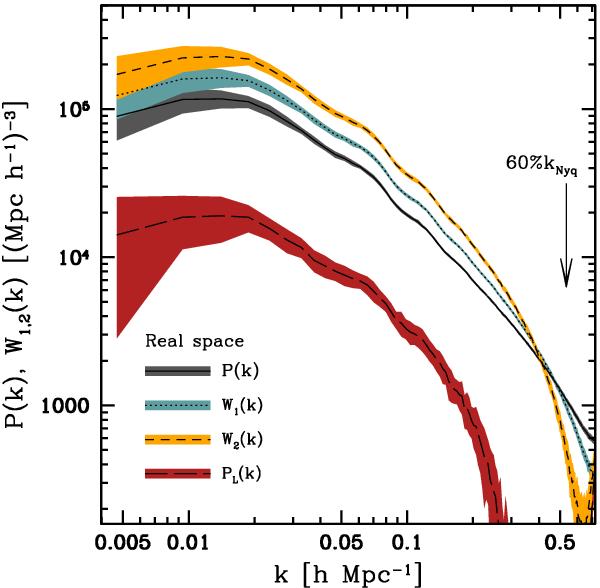
Mean power spectra  ,
,
 and
and  (defined in Sect. 2.3) obtained from the
ensemble of N-body simulations for galaxy clusters within
the full luminosity range as described in the text. The 60% of the Nyquist frequency is
marked with an arrow. The shaded regions denote the standard deviation obtained
from the ensemble of N-body simulations.
(defined in Sect. 2.3) obtained from the
ensemble of N-body simulations for galaxy clusters within
the full luminosity range as described in the text. The 60% of the Nyquist frequency is
marked with an arrow. The shaded regions denote the standard deviation obtained
from the ensemble of N-body simulations.
Current usage metrics show cumulative count of Article Views (full-text article views including HTML views, PDF and ePub downloads, according to the available data) and Abstracts Views on Vision4Press platform.
Data correspond to usage on the plateform after 2015. The current usage metrics is available 48-96 hours after online publication and is updated daily on week days.
Initial download of the metrics may take a while.