Fig. 8
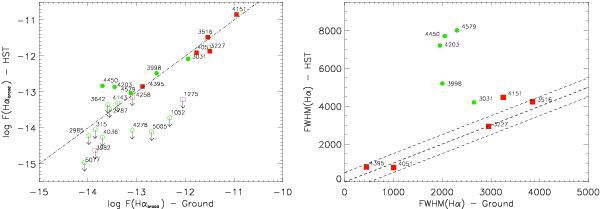
Logarithmic fluxes (left, in erg s-1 cm-2) and full width at half maximum (right, in km s-1) of the Hα broad line emission obtained from the HST/STIS spectra compared to the results of the Palomar spectroscopic survey. The dashed line has a slope equal to one. The green symbols represent the LINERs of the sample, while the red squares are the Seyferts. NGC 1275, the ambiguous galaxy, is marked with a purple square. Empty symbols refer to the undetected BLR.
Current usage metrics show cumulative count of Article Views (full-text article views including HTML views, PDF and ePub downloads, according to the available data) and Abstracts Views on Vision4Press platform.
Data correspond to usage on the plateform after 2015. The current usage metrics is available 48-96 hours after online publication and is updated daily on week days.
Initial download of the metrics may take a while.