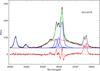
Fig. 6
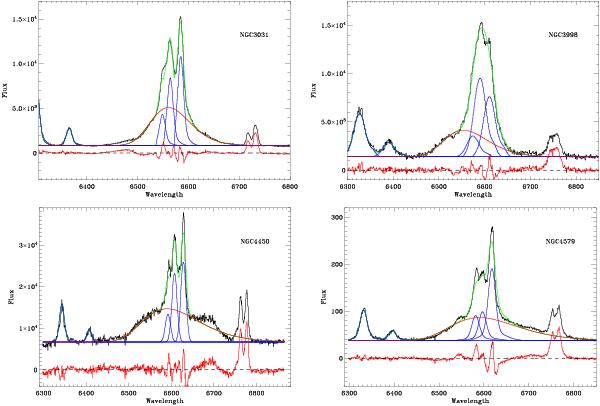
Spectra of the LINERs with a clear BLR, in addition to NGC 4203 presented above, modeled using [O I] as template for the narrow lines. The broad Hα (red curve) is reproduced with a skewed Gaussian. The original spectrum is in black, the individual narrow lines are in blue, the total line emission in green, the residuals in red. Wavelengths are in Å, while fluxes are in units of 10-18erg s-1 cm-2 Å-1.
Current usage metrics show cumulative count of Article Views (full-text article views including HTML views, PDF and ePub downloads, according to the available data) and Abstracts Views on Vision4Press platform.
Data correspond to usage on the plateform after 2015. The current usage metrics is available 48-96 hours after online publication and is updated daily on week days.
Initial download of the metrics may take a while.