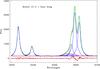
Fig. 4
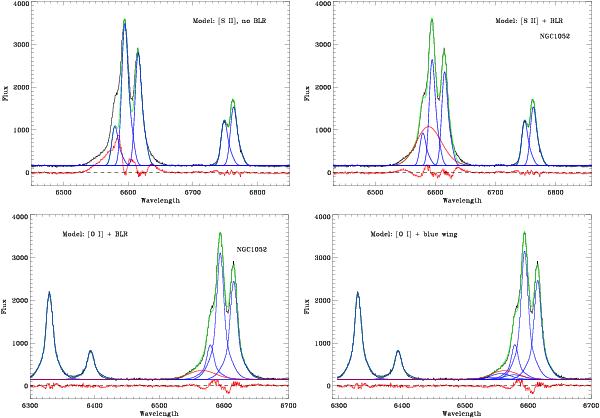
Top left: spectrum of NGC 1052 modeled by adopting the same shape as obtained from the Gaussian fitting of the [S II] doublet for the Hα and [N II] lines. The Hα and [N II] intensities are set by matching their respective emission peaks. The original spectrum is in black, the individual lines are in blue, the total line emission in green, the residuals in red. Top right: same as in the left panel but including a broad Hα component (red). Bottom left: same as in the top right panel, but using the [O I] doublet as template. Bottom right: same as in the bottom left panel, but including blue wings to the narrow lines instead of a BLR. Wavelengths are in Å, while fluxes are in units of 10-18erg s-1 cm-2 Å-1.
Current usage metrics show cumulative count of Article Views (full-text article views including HTML views, PDF and ePub downloads, according to the available data) and Abstracts Views on Vision4Press platform.
Data correspond to usage on the plateform after 2015. The current usage metrics is available 48-96 hours after online publication and is updated daily on week days.
Initial download of the metrics may take a while.