Fig. 11
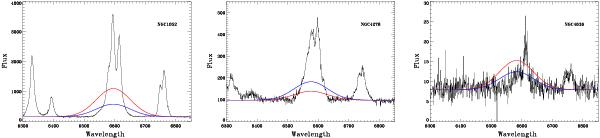
Comparison of the HST spectrum with two predicted BLR synthetic profile for NGC 1052 (left), NGC 4278 (center), and NGC 4636 (right). The blue curve represents a BLR with flux derived from the X-ray flux and a width of 6500 km s-1, conservatively reduced by a factor 10 to explore its detectability in the HST spectrum. The normalization of the red curve is derived from the [O III] flux, in this case reduced by a factor of 3.
Current usage metrics show cumulative count of Article Views (full-text article views including HTML views, PDF and ePub downloads, according to the available data) and Abstracts Views on Vision4Press platform.
Data correspond to usage on the plateform after 2015. The current usage metrics is available 48-96 hours after online publication and is updated daily on week days.
Initial download of the metrics may take a while.