Fig. 1
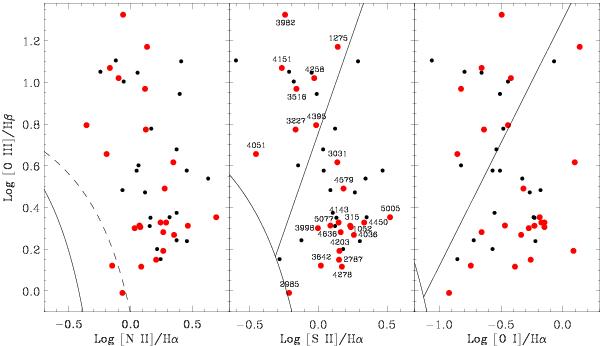
Spectroscopic diagnostic diagrams for the galaxies of the Palomar sample with reported broad lines. The red (black) dots represent galaxies with (without) available HST spectra. The solid lines are from Kewley et al. (2006) and separate star-forming galaxies, LINER, and Seyfert; in the left panel, the region between the two curves is populated by the composite galaxies.
Current usage metrics show cumulative count of Article Views (full-text article views including HTML views, PDF and ePub downloads, according to the available data) and Abstracts Views on Vision4Press platform.
Data correspond to usage on the plateform after 2015. The current usage metrics is available 48-96 hours after online publication and is updated daily on week days.
Initial download of the metrics may take a while.