Fig. 6
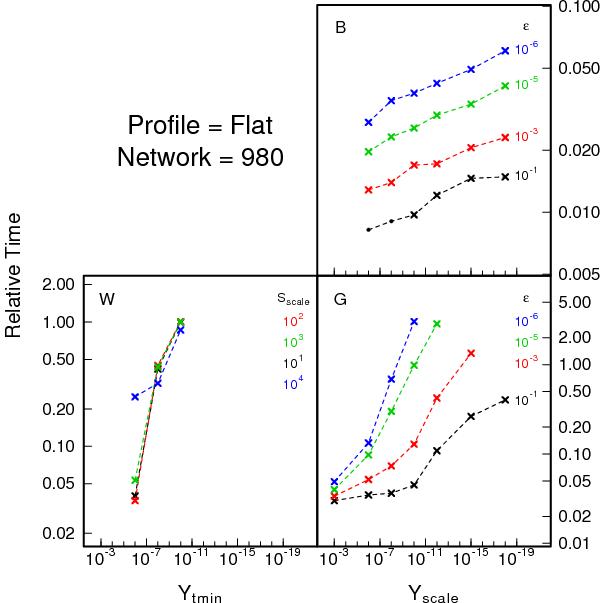
Run-times computed for case 1: “Flat”, and normalised to the Wagoner’s method calculation with Sscale = 1000 and yt,min = 10-12 (see text). Points indicated with a cross represent calculations that completed successfully with abundances that meet the accuracy criteria outlined in the text. Missing data points represent runs that did not successfully run, either arising from convergence problems within the code or from exceeding the maximum number of time-steps allowed. The labels “W”, “B”, and “G” represent run-times for Wagoner’s, the Bader-Deuflehard, and Gear’s methods, respectively.
Current usage metrics show cumulative count of Article Views (full-text article views including HTML views, PDF and ePub downloads, according to the available data) and Abstracts Views on Vision4Press platform.
Data correspond to usage on the plateform after 2015. The current usage metrics is available 48-96 hours after online publication and is updated daily on week days.
Initial download of the metrics may take a while.