Fig. 5
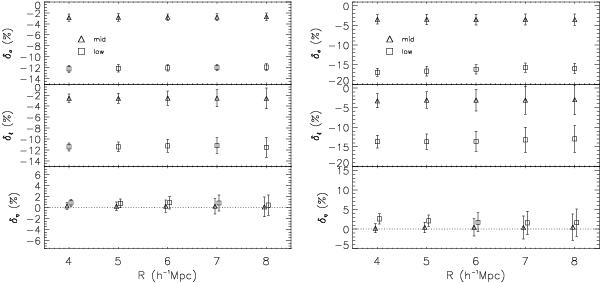
Testing the sensitivity of η to the bias of the adopted tracers.
Clustering statistics are estimated from two sub sets of the halo simulated
catalogues, known as mid and low sub-samples tant
include haloes with masses limited to M < 1013 h-1 M⊙ and
M < 1012 h-1 M⊙,
respectively. The left and right panels show the relative variation
in the variance  (upper), correlation function δξ ≡ ξg,R/ξg, R, ref − 1
(central), and clustering ratio δη ≡ ηg,R/ηg, R, ref − 1
with respect to the measurements from the full mock catalogues that contain all
haloes with masses up to M = 7 × 10¹⁴ h-1 M⊙ for
these two catalogues. In the left panel, quantities are measured
from the Bh halo catalogues in real space,
while the measurements on the right are performed in redshift space using the
Lh light-cones. Error bars are
estimated using the dispersion among the mock catalogues. For the sake of clarity, a
relative shift along the abscissa is applied to the data in the bottom
plots.
(upper), correlation function δξ ≡ ξg,R/ξg, R, ref − 1
(central), and clustering ratio δη ≡ ηg,R/ηg, R, ref − 1
with respect to the measurements from the full mock catalogues that contain all
haloes with masses up to M = 7 × 10¹⁴ h-1 M⊙ for
these two catalogues. In the left panel, quantities are measured
from the Bh halo catalogues in real space,
while the measurements on the right are performed in redshift space using the
Lh light-cones. Error bars are
estimated using the dispersion among the mock catalogues. For the sake of clarity, a
relative shift along the abscissa is applied to the data in the bottom
plots.
Current usage metrics show cumulative count of Article Views (full-text article views including HTML views, PDF and ePub downloads, according to the available data) and Abstracts Views on Vision4Press platform.
Data correspond to usage on the plateform after 2015. The current usage metrics is available 48-96 hours after online publication and is updated daily on week days.
Initial download of the metrics may take a while.