Fig. 11
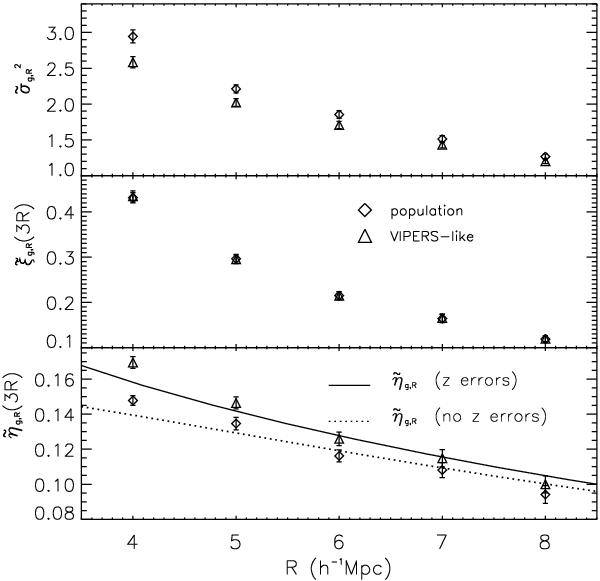
Impact and handling of the VIPERS redshift measurement errors on the usual
statistical quantities that enter the definition of η, as plotted as a
function of the filtering scale R and tested using the Lg mock
catalogues. Triangles correspond to measurements performed after adding a redshift
error randomly drawn from a Gaussian distribution with standard deviation
σcz = 141(1 + z)
to each galaxy position, which is representative of the errors affecting VIPERS
redshifts (Guzzo et al. 2013). Diamonds give
the reference values and are computed in redshift space without measurement errors.
The dotted and solid lines give the clustering ratio predicted by Eq. (8) when a dispersion σv = 100 km s-1
or  (i.e. adding in quadrature the expected redshift error) are used, respectively.
Expectation values and error bars are computed from the mocks in the usual way.
(i.e. adding in quadrature the expected redshift error) are used, respectively.
Expectation values and error bars are computed from the mocks in the usual way.
Current usage metrics show cumulative count of Article Views (full-text article views including HTML views, PDF and ePub downloads, according to the available data) and Abstracts Views on Vision4Press platform.
Data correspond to usage on the plateform after 2015. The current usage metrics is available 48-96 hours after online publication and is updated daily on week days.
Initial download of the metrics may take a while.