Fig. 10
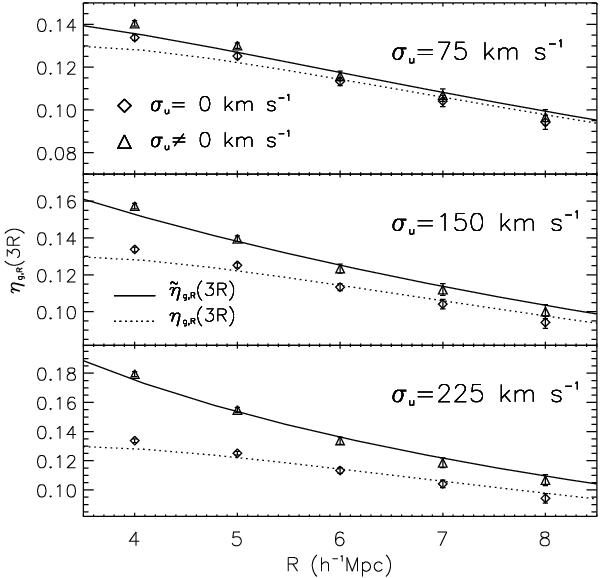
Clustering ratio ηg,R estimated
from Lh haloes in real space (diamonds)
is shown as a function of the filtering radius R and of the
correlation length r = 3R. We also plot the
clustering ratio  estimated after perturbing the cosmological redshift of haloes with random errors
(triangles). These random velocities are drawn from a Gaussian distribution with
standard deviation σcz = (1 + z)σu
km s-1 with
σu as
indicated. Also shown is the theoretically predicted value of
obtained by inserting into Eq. (8)
the corresponding value of σu. The points
and error bars correspond to the average and standard deviation of the mean of the
measurements over 31Lh catalogues. Such error bars, in
practice, would correspond to the typical uncertainty in a survey with
31 times larger volume
and 10 times higher galaxy number density than the VIPERS W4 sample.
estimated after perturbing the cosmological redshift of haloes with random errors
(triangles). These random velocities are drawn from a Gaussian distribution with
standard deviation σcz = (1 + z)σu
km s-1 with
σu as
indicated. Also shown is the theoretically predicted value of
obtained by inserting into Eq. (8)
the corresponding value of σu. The points
and error bars correspond to the average and standard deviation of the mean of the
measurements over 31Lh catalogues. Such error bars, in
practice, would correspond to the typical uncertainty in a survey with
31 times larger volume
and 10 times higher galaxy number density than the VIPERS W4 sample.
Current usage metrics show cumulative count of Article Views (full-text article views including HTML views, PDF and ePub downloads, according to the available data) and Abstracts Views on Vision4Press platform.
Data correspond to usage on the plateform after 2015. The current usage metrics is available 48-96 hours after online publication and is updated daily on week days.
Initial download of the metrics may take a while.