Fig. 6
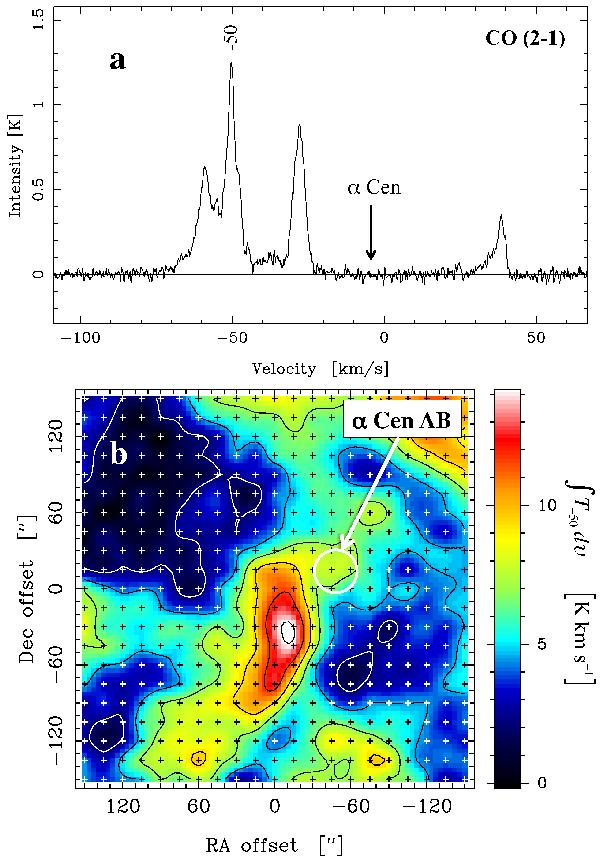
a) Grand average of all CO (2–1) spectra, in Tmb vs. υLSR, of the 5′ × 5′ map toward α Centauri. Strong emission features at several lsr-velocities are evident in this direction of the Galaxy (ℓII = 315 73, bII = −068), with the strongest line at υLSR = −50 km s-1. b) Integrated intensity map of the CO (2–1) line at υLSR = −50 km s-1, i.e. ∫ T-50 dυ, in the direction of α Centauri (for APEX and at ν = 230 GHz, ∫ T dυ (K km s-1) = 6 × 10¹⁵ ∫ Fν dν (erg cm-2 s-1)). The origin of the map is at the J2000 equatorial coordinates of α Cen B, i.e RA = 14h39m35
 06 and Dec = −60° 50′ 15
 1, and read-out positions are marked by crosses. At the time of observation (16 August 2012), the star is located at the centre of the white ring. The bright feature south of the map centre is also prominent in the continuum observations longward of 100 μm (cf. Fig. 2) and is the dominating source at 870 μm (Fig. 5).
Current usage metrics show cumulative count of Article Views (full-text article views including HTML views, PDF and ePub downloads, according to the available data) and Abstracts Views on Vision4Press platform.
Data correspond to usage on the plateform after 2015. The current usage metrics is available 48-96 hours after online publication and is updated daily on week days.
Initial download of the metrics may take a while.