Fig. 10
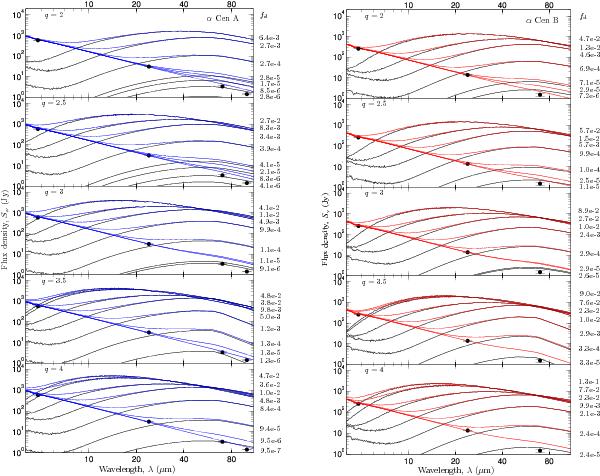
Left: mid-infrared SEDs for α Cen A for different values of the power-law exponent q of the size distribution function, viz. n(a) ∝ a − q. Black curves depict dust SEDs, whereas blue curves display the total, i.e.  . For each q, there are graphs for a selection of initial dust mass estimates and the fractional dust luminosity, fd = Ldust/Lstar, is shown next to each curve. The 100 μm data were not part of the fitting procedure. Right: same as the left panel but for α Cen B and with the total emission shown in red.
Current usage metrics show cumulative count of Article Views (full-text article views including HTML views, PDF and ePub downloads, according to the available data) and Abstracts Views on Vision4Press platform.
Data correspond to usage on the plateform after 2015. The current usage metrics is available 48-96 hours after online publication and is updated daily on week days.
Initial download of the metrics may take a while.