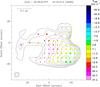
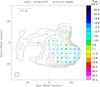
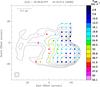
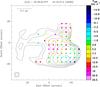
Fig. 5

22 GHz continuum map of DR 21 (contours; same as Fig. 1). The dots represent the Gaussian fitting results; their positions correspond to the centers of the boxes. The systemic velocity of the molecular material is ≈ −1.5 km s-1 (green in the upper panels). a)–b) The dot size scales logarithmically with the amplitude of the Gaussians. c) The color of the dots represents the velocity difference between the two Gaussian components. The figure shows that the velocity difference between the two components increases from the head down the tail in both H ii regions. d) The color of the dots represents |vGauss1 − vsys|−|vGauss2 − vsys|, an indication of asymmetry in the velocity structure of the ionized gas (see also Sect. 4). In each panel, the synthesized beam is shown in the lower left corner, and a scale of 0.1 pc is indicated in the upper left corner.
Current usage metrics show cumulative count of Article Views (full-text article views including HTML views, PDF and ePub downloads, according to the available data) and Abstracts Views on Vision4Press platform.
Data correspond to usage on the plateform after 2015. The current usage metrics is available 48-96 hours after online publication and is updated daily on week days.
Initial download of the metrics may take a while.