Fig. 5
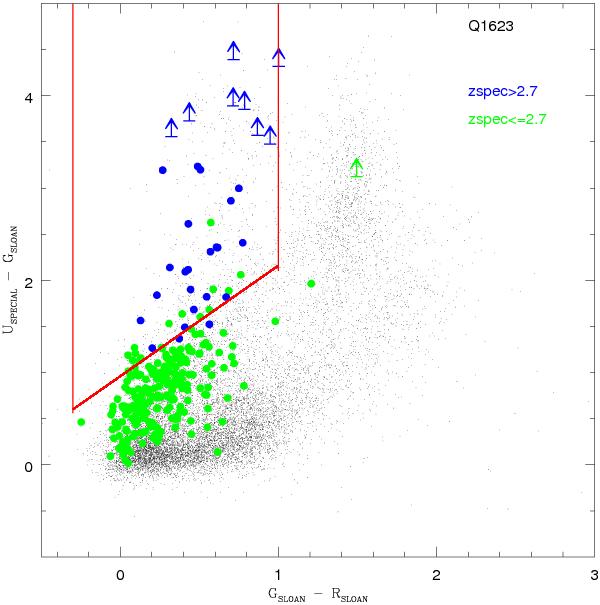
U − G vs. G − R diagram that was used for the selection of the LBG candidates in the field Q1623, that is the deepest of the three. Red lines indicate the selection color locus. Green symbols indicate sources with spectroscopic redshift zsp ≤ 2.7, and blue symbols show LBGs with zsp > 2.7 (Reddy, priv. comm.). Vertical arrows indicate upper limits in the U band. Black points indicate all sources detected in the field with R ≤ 25.0. Sources with spectroscopic redshift have magnitudes R ≤ 25.5.
Current usage metrics show cumulative count of Article Views (full-text article views including HTML views, PDF and ePub downloads, according to the available data) and Abstracts Views on Vision4Press platform.
Data correspond to usage on the plateform after 2015. The current usage metrics is available 48-96 hours after online publication and is updated daily on week days.
Initial download of the metrics may take a while.