Free Access
Fig. 3
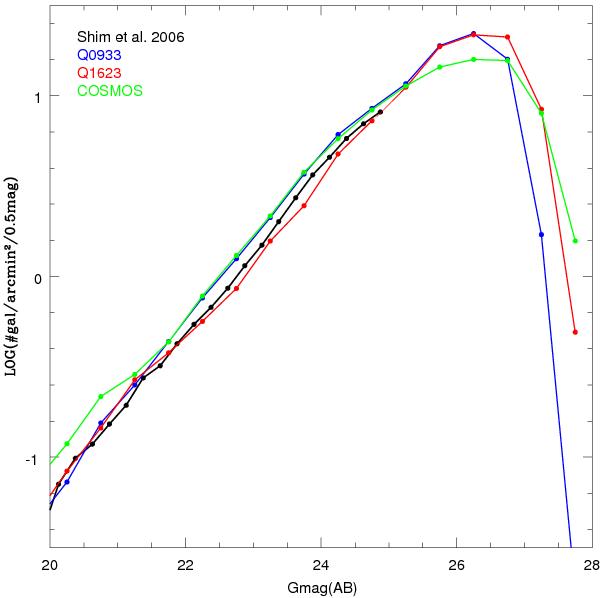
Galaxy counts in the G band for each of our fields separately. The magnitudes of the galaxies for this plot were derived by single-mode photometry, detecting sources directly in the G-band images. Although we see some scatter in the bright end, there is overall agreement when compared to the literature (Shim et al. 2006).
Current usage metrics show cumulative count of Article Views (full-text article views including HTML views, PDF and ePub downloads, according to the available data) and Abstracts Views on Vision4Press platform.
Data correspond to usage on the plateform after 2015. The current usage metrics is available 48-96 hours after online publication and is updated daily on week days.
Initial download of the metrics may take a while.